
Soil moisture level in European wine districts, June 2026 + + + +

Soil moisture have seldom been lower in Europe than in June 2026. This could greatly affect the output and quality of grapes in wine districts across Europe.
Portugal, Spain, France and Italy are especially affected by the drought that has been ongoing for several months. The map shows the deviation from normal levels in June. It compares June 2026 against the average between 1991–2020.
I tested multiple version, but ended up with a jigsaw-puzzle map that shows the territorial unit NUTS 3. This isn’t perfect, as the politically drawn borders don’t overlap perfectly with the wine districts. A wine district might cross multiple areas. It does however provide some clarity within the constraints of Datawrapper and small, editorial maps.
A different idea I toyed with, was a map that extracted the wine districts as a difference from a regular polygon of Europe. This would display the same heatmap, but only for the wine districts while the rest of Europe would be white. In theory I think this would be a better map, it would show the moisture levels at the exact position of the wine districts, removing any constructed political borders. However, the fidelity of the wine district proved to be too small and spattered for any small editorial map. It needed some generalisation, especially for a mobile screen.
You can see the result of that below.
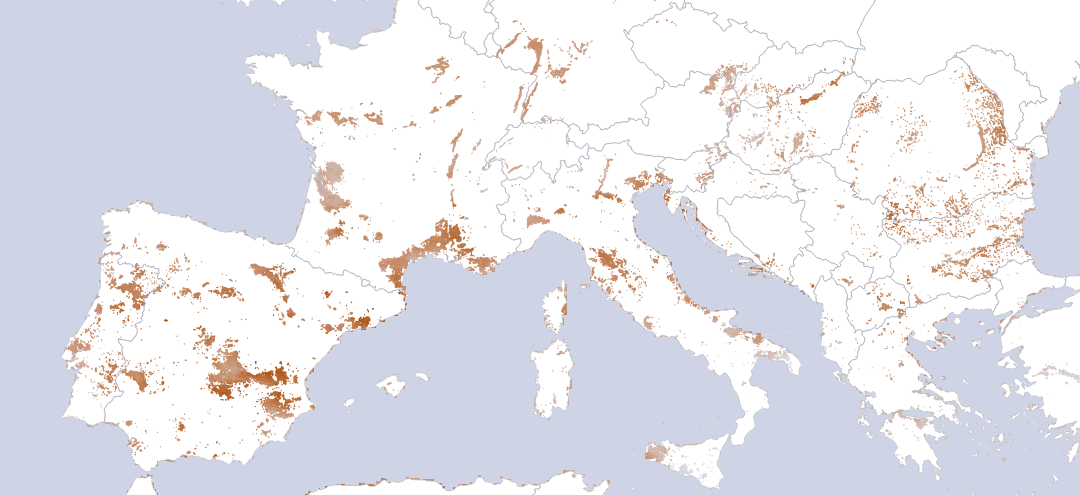
The first version of the map, showing moisture levels in only the wine districts.